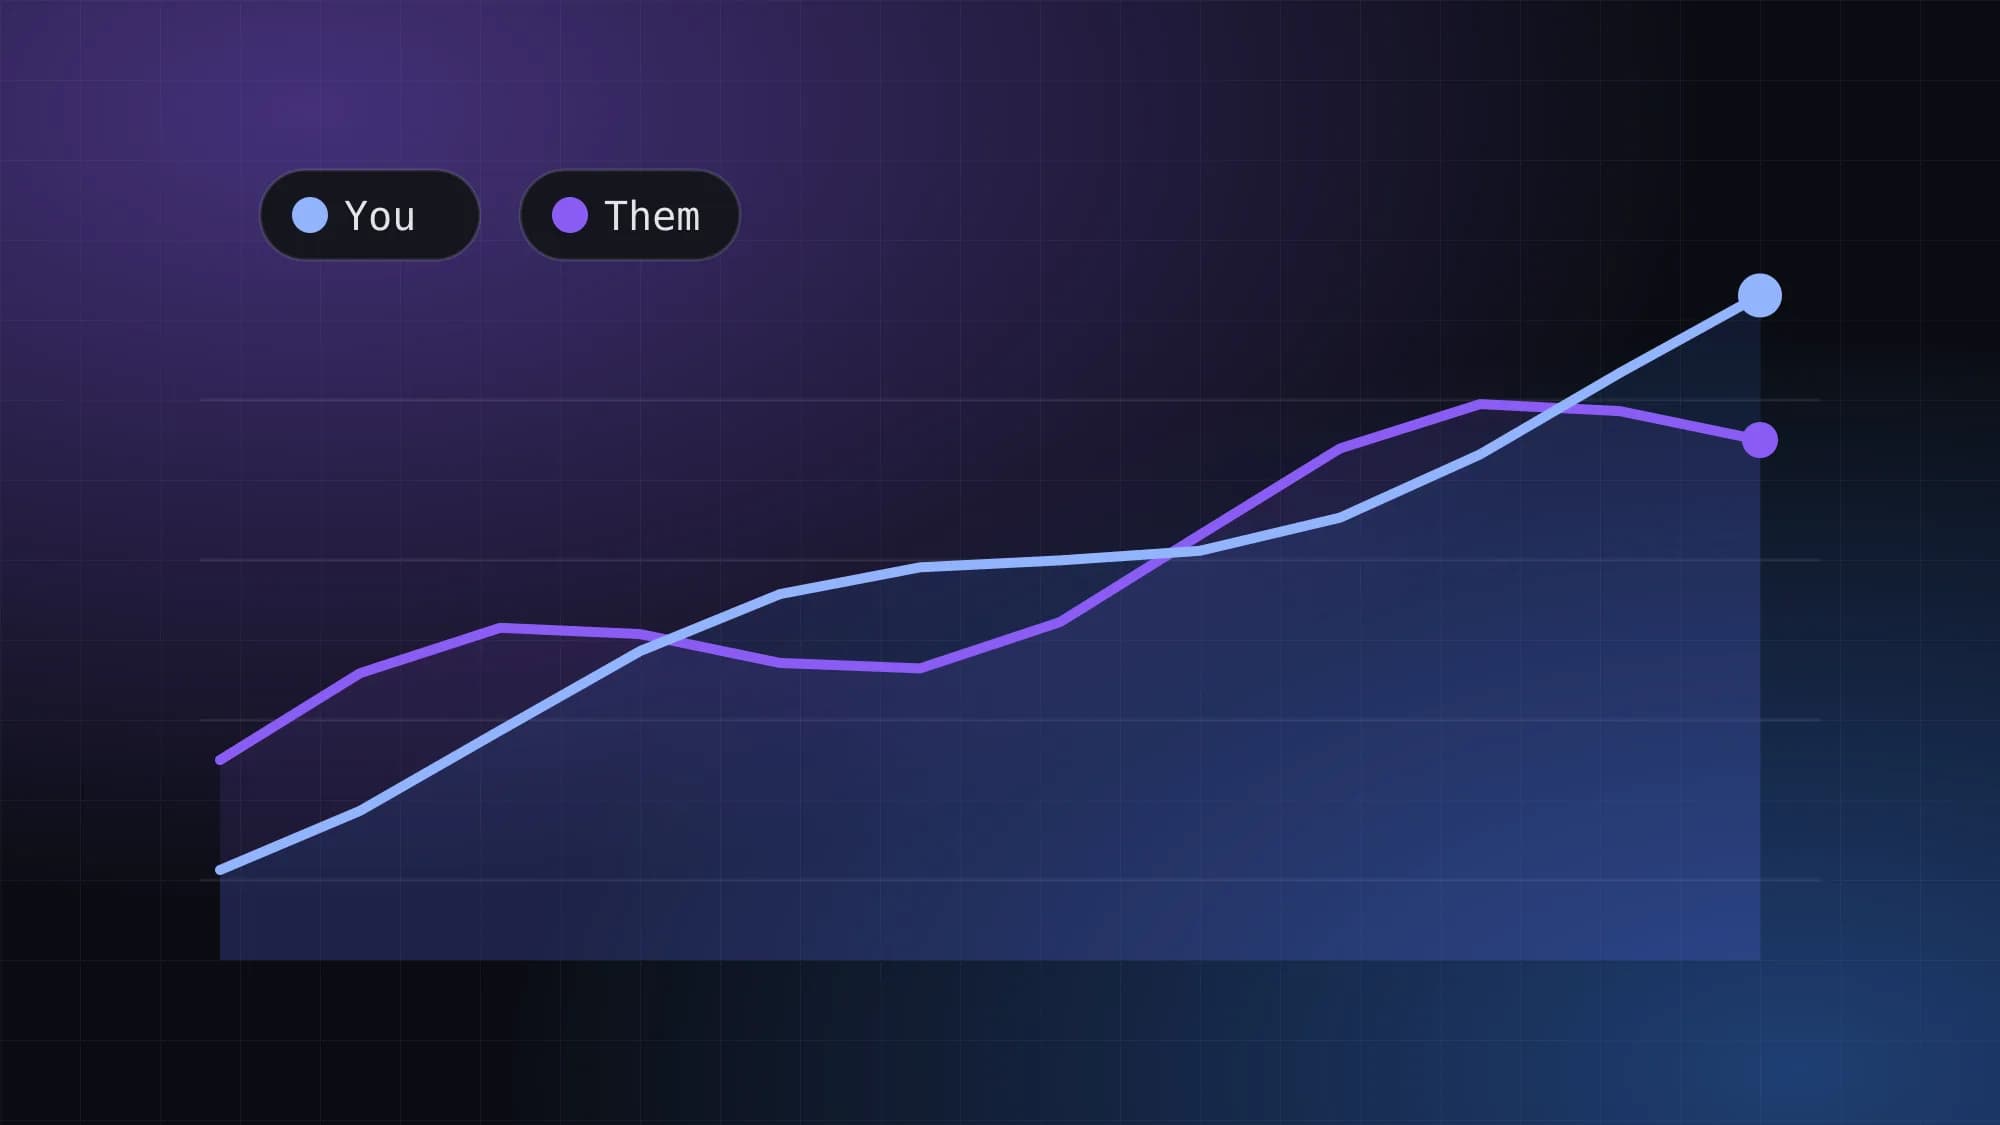
Engagement rate, explained: which formula to use and when
There's no single engagement rate. There are several, and each answers a different question. Here's how to pick the right one and report it honestly.
2 min read

Engagement rate is one of the most quoted numbers in social media reporting, and one of the most misunderstood. Two teams can both say "our engagement rate is up" and mean completely different things.
That's because there isn't one formula. There are several, and each one answers a different question.
What counts as an engagement
First, agree on what you're counting. Most teams include likes or reactions, comments, shares and saves. Some include link clicks or profile visits. Whatever you choose, write it down and keep it consistent, or month-to-month comparisons mean nothing.
The common formulas
Engagement rate by reach
Engagements ÷ reach × 100. Of the people who saw this post, how many engaged with it? This is usually the best measure of how compelling the content itself was, because it accounts for how many people actually saw it.
Engagement rate by followers
Engagements ÷ followers × 100. Useful for comparing accounts of different sizes, including competitors, since follower counts are public and reach usually isn't. It's less precise, because many followers never see a given post.
Engagement rate by impressions
Engagements ÷ impressions × 100. Impressions count every view, including repeat views by the same person. This works well for paid content, where you're paying per impression.
Daily engagement rate
Total engagements in a day ÷ followers × 100. A way to see how engaged your audience is over time, regardless of how many posts you published.
Which one should you use?
- To judge which posts worked best, use engagement by reach.
- To compare against competitors, use engagement by followers.
- To evaluate paid campaigns, use engagement by impressions.
- To track audience health over time, use daily engagement.
It's fine to report more than one, as long as each is labeled clearly.
Reporting it honestly
A few habits keep engagement numbers meaningful:
- Compare like with like. Reels and carousels behave differently; so do networks.
- Look at trends, not single posts. One viral post can distort a month.
- Pair engagement with outcomes. Clicks, sign-ups and sales tell you whether engagement is leading anywhere.
Getting the numbers without spreadsheets
Pulling reach, impressions and interactions for every post by hand is slow. Panoramiq Insights brings analytics for Instagram posts, stories and accounts into Hootsuite, Channelview Insights does the same for YouTube channels and videos, and Pendulum covers TikTok. With the data in one place, choosing the right formula becomes the hard part, which is how it should be.